Images in python#
This notebook was based on 00_images_are_arrays from the Scipy-2023-image-nalaysis repository under BSD 3-Clause “New” or “Revised” License.
In this notebook we will show how to open images and how to display them. Inorder to do that, we need to introduce three python libraries: scikit-image, numpy and matplotlib.
Breifly, scikit-image is a collection of python functions for image processing, numpy is the fundamental package for scientific computing with python and matplotlib is the standardlibrary for plotting with python.
Images are numpy arrays#
Images are represented in scikit-image using standard numpy arrays. This allows maximum inter-operability with other libraries in the scientific Python ecosystem, such as matplotlib and scipy.
Below we import numpy and give it an alias: ‘np’.
import numpy as np
We can build a 1D numpy array with np.array()
numpy_array = np.array(
    [0, 1, 2, 3]
)
numpy_array
array([0, 1, 2, 3])
To build a 2D numpy array, we simply add another level of square brackets:
numpy_array = np.array(
    [
        [1, 2, 3],
        [4, 5, 6]
    ]
)
numpy_array
array([[1, 2, 3],
       [4, 5, 6]])
We can check the shape of this arrays with .shape. This returns a tuple with the number os rows and the number of columns of our numpy array.
numpy_array.shape
(2, 3)
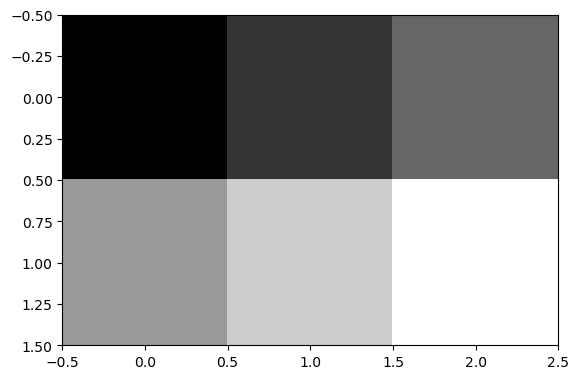
A 2D numpy array can alrady be understood as an image, where the values correspond to intensity of each pixel. Let’s use .imshow() matplotlib to visualize it as an image.
The cmap='gray' argument defines that the values should be displayed with a grayscale palette.
import matplotlib.pyplot as plt
plt.imshow(numpy_array, cmap='gray')
<matplotlib.image.AxesImage at 0x22f7f88a340>
See? Images are numpy arrays!
The same holds for “real-world” images. Take a look at some example images loaded from scikit-image below.
from skimage import data

coins = data.coins()

plt.imshow(coins, cmap='gray')
<matplotlib.image.AxesImage at 0x22f00d723a0>
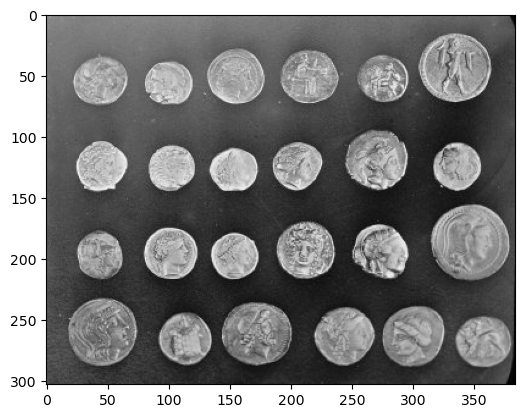
We can check that coins is an array by assessing type.
type(coins)
numpy.ndarray
A color image is a 3D array, where the last dimension has size 3 and represents the red, green, and blue channels:
cat = data.chelsea()
plt.imshow(cat)
<matplotlib.image.AxesImage at 0x22f01f153d0>
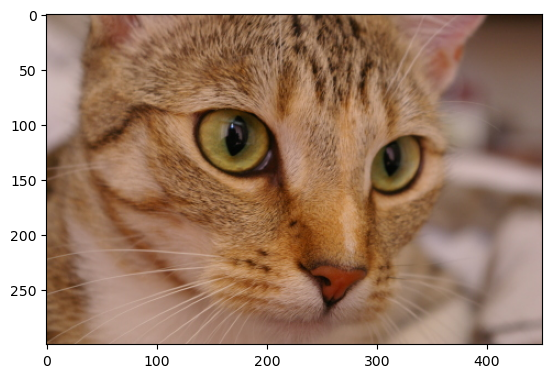
cat.shape
(300, 451, 3)
Exercise: visualizing RGB channels#
Display the different color channels of the image along (each as a gray-scale image). Start with the following template:
 # get channel 0 from cat image
red_channel =
# get channel 1 from cat image
green_channel =
# get channel 2 from cat image
blue_channel =